Of course, the path from A to B was anything but linear with a financial crisis, housing bubbles in major cities, and now COVID-19, which is drastically altering market dynamics. How has the housing market evolved, on a city-by-city basis?
Two Decades of Housing Prices
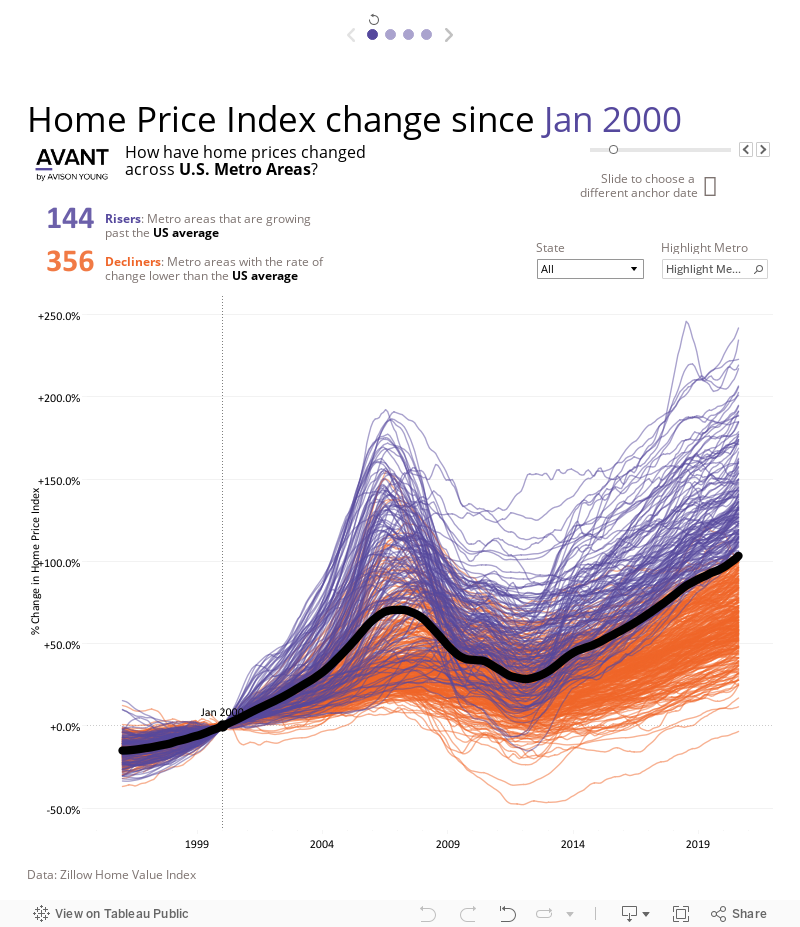
The interactive visual below – created by Avison Young Global, using data from Zillow – is a comprehensive look at U.S. home price data over the past two decades.
Editor’s note: Click the circles at the top of the visualization to see other versions of the data, including price changes at the state and zip code level.
The Lay of the Land
A number of things become apparent when looking at historical data of hundreds of U.S. cities. First, the trajectory of home prices is defined by the 2008 Financial Crisis. After prices took a steep dive, it took a full decade for the average home price to rise back up to the 2007 peak. Next, broadly speaking, the U.S. average is being “pulled up” by the hottest regional markets. The majority of housing markets have seen between a 50% and 100% increase in price over the past 20 years. This is also true at the state level, where booming markets such as Hawaii saw price increases double the U.S. average.
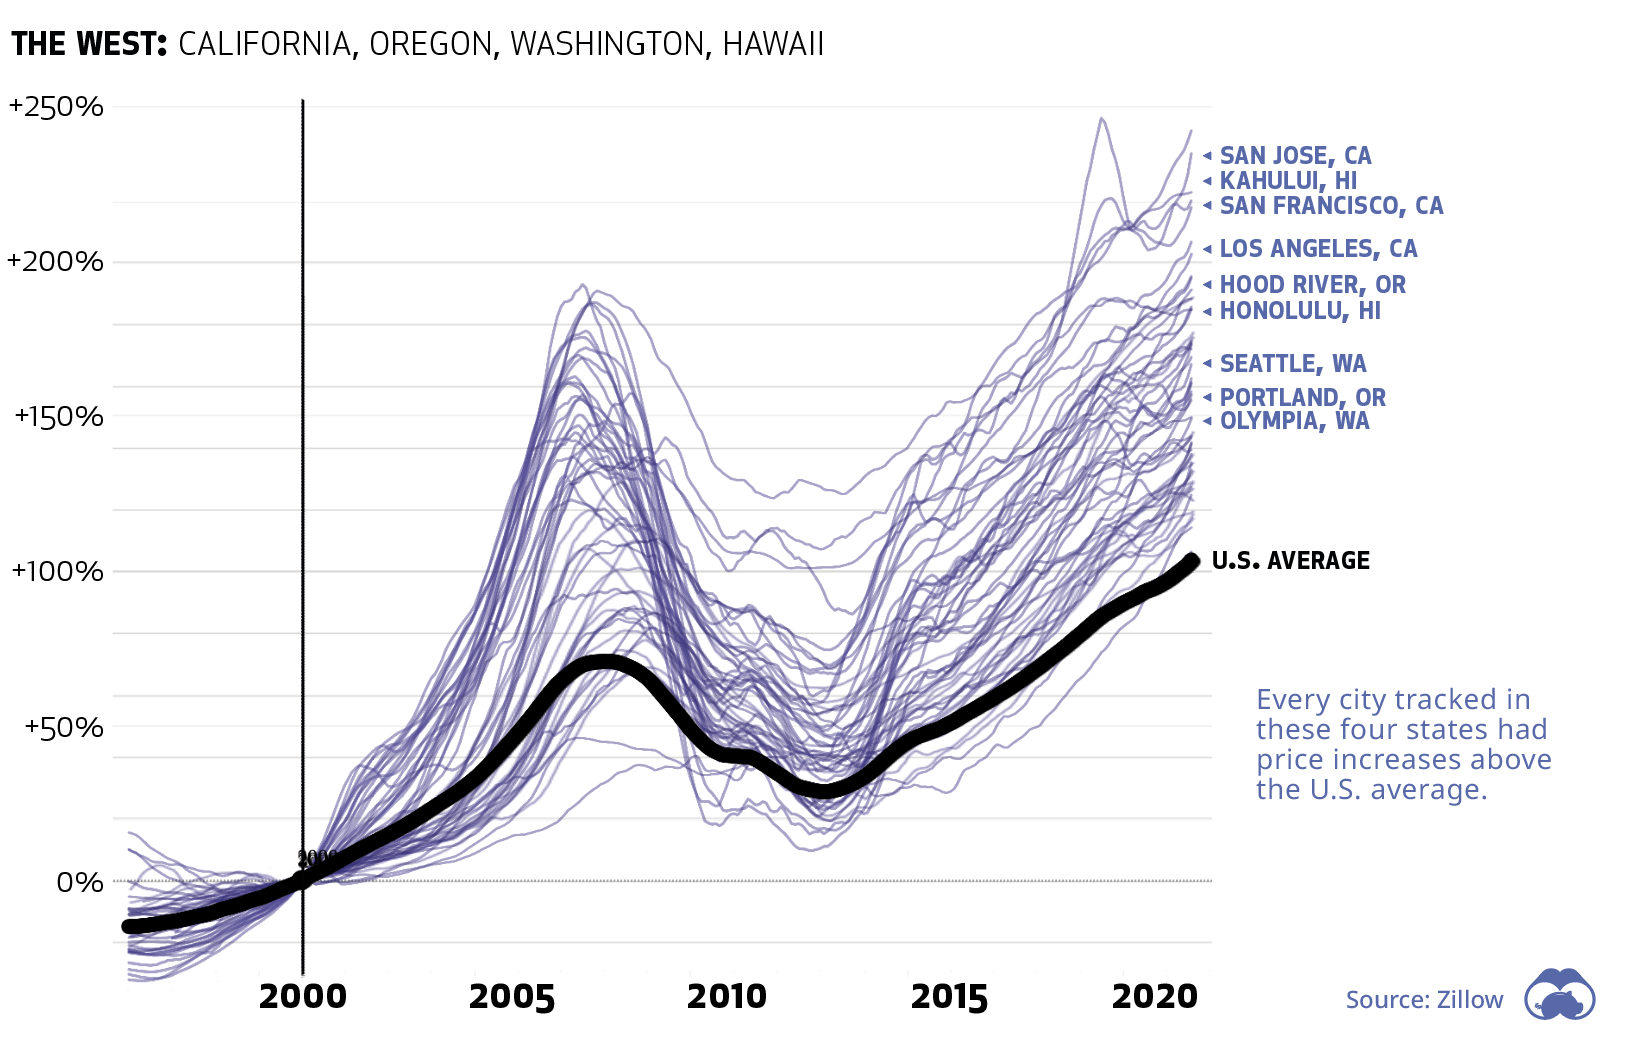
Going West
The West Coast has seen dramatic home price appreciation in over the last two decades, a trend that permeated the entire region. Every single city tracked in this database beat the U.S. average.
California and Hawaii saw the biggest gains, with a number of cities ending up with a 200%+ increase over prices in 2000. The biggest gains in the entire country over the time period was Madera, California, which is located just north of Fresno. The nearby cities of San Jose and San Francisco rose by an impressive 235% and 219%, respectively. As a practical example – during the meteoric rise of Silicon Valley, average prices in San Francisco shot up from $364,000 to $1.12 million. Even the bottom city (Yakima, Washington) on the left coast saw an increase of 114%.
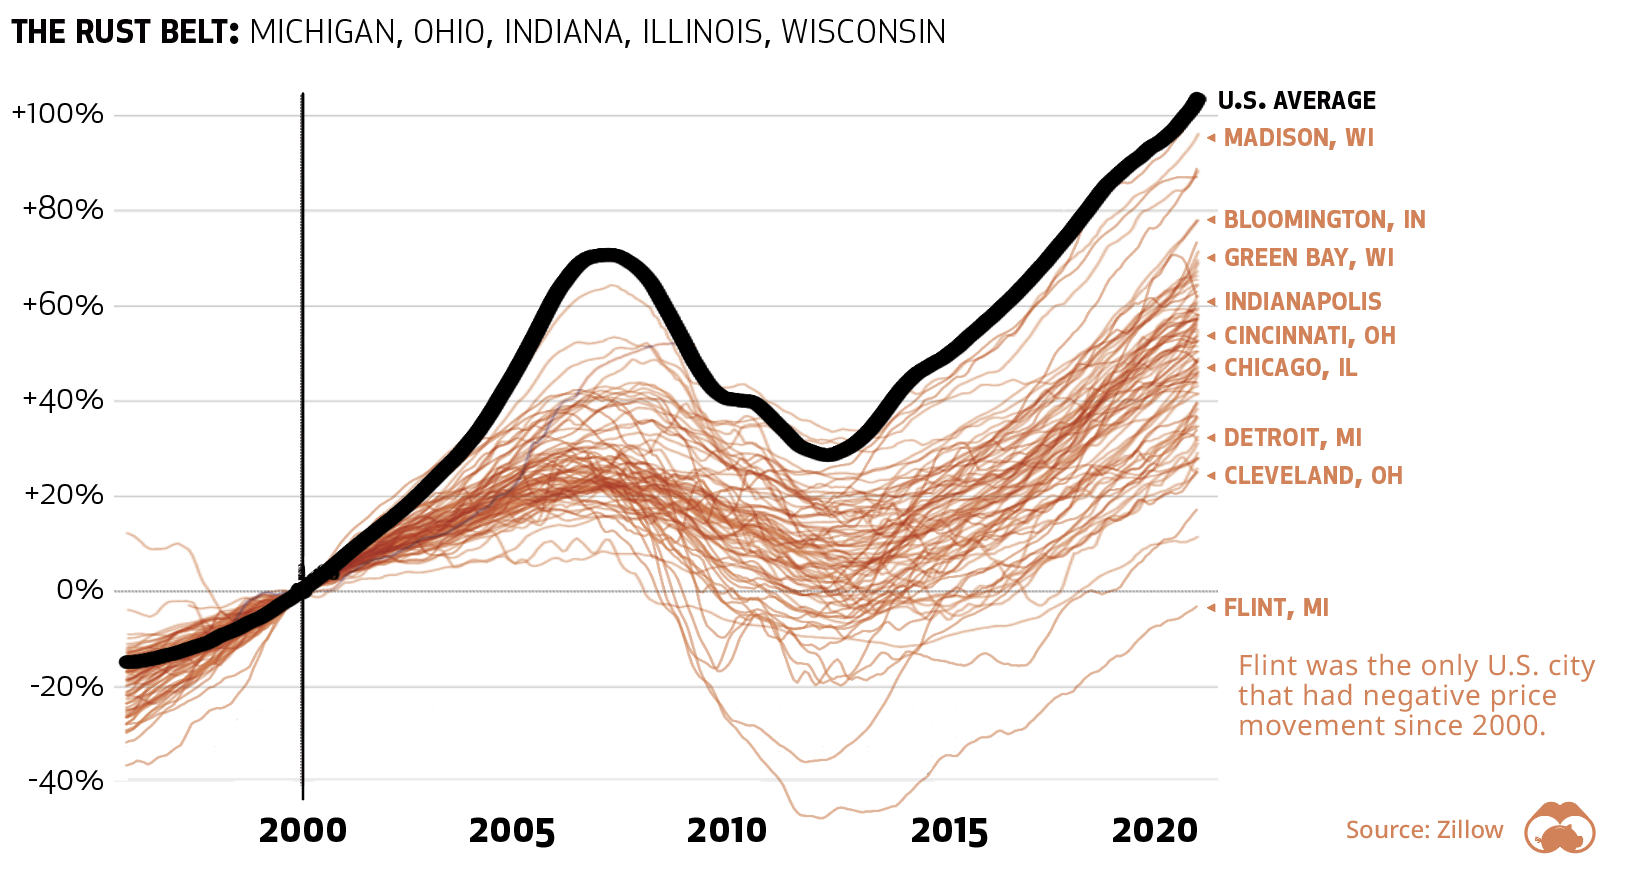
Slower Home Price Changes
In general, cities located in America’s “Rust Belt” states saw slower home price growth. In fact, every city in these five states saw price growth below the U.S. average.
Of the top 20 U.S. metros, Detroit and Chicago saw the slowest price growth over the past two decades. Flint, Michigan, was the only city in the country to see a price decline. At the state level, Illinois, Michigan, and Ohio were the bottom three in terms of home price appreciation.
A Useful Barometer
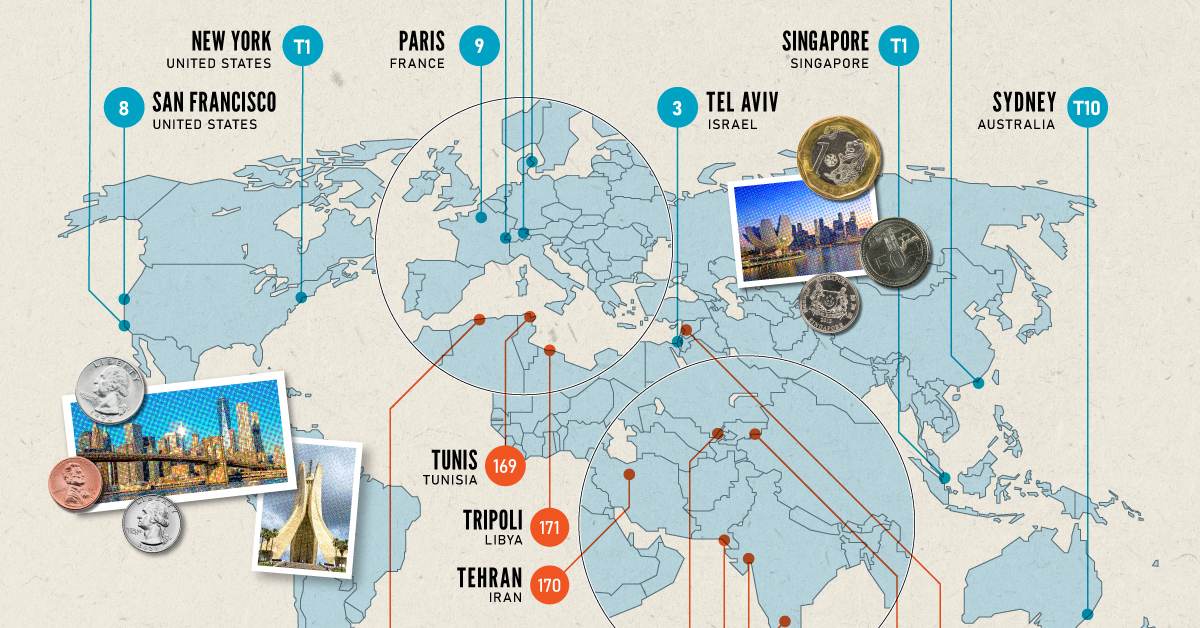
Looking at country or state level data fails to capture the incredible nuance of home values around the country. That said, since the value of a primary residence makes a significant portion of wealth for most Americans, these price movements serve as a useful barometer of the health of the real estate market, and the economy as a whole. on Cities become “expensive” due to a variety of factors such as high demand for housing, a concentration of high-paying businesses and industries, and a high standard of living. Additionally, factors such as taxes, transportation costs, and availability of goods and services can also contribute to the overall cost of living in global cities. The infographic above uses data from EIU to rank the world most and least expensive cities to live in. To make the list, the EIU examines 400+ prices for over 200 products and services in 172 cities, surveying a variety of businesses to track price fluctuations over the last year.
Inflation + Strong Currency = Expensive Cities
If you live in a city where many residents find it challenging to put a roof over their heads, food on their plates, and make ends meet, you live in an expensive city. But if this inflation is compounded with a strong national currency, you may live in one of the world’s most expensive cities. Singapore and New York City tied for the first rank amongst the world’s most expensive cities in 2022, pushing Israel’s Tel Aviv from the first place in 2021 to the third place in 2022. Both these cities had high inflation and a strong currency. Surprisingly, this is the Big Apple’s first time atop the ranking. The city with one of the most expensive real estate markets worldwide, Hong Kong ranked fourth in this list, followed by Los Angeles, which moved up from its ninth rank in 2021.
Poor Economies = Cheaper Cities
Asia continues to dominate the list of the world’s least expensive cities, followed by parts of North Africa and the Middle East. Though affordability sounds good at face value, sitting at the bottom of the ranking isn’t necessarily a coveted position. While the cost of living in some of the cities in these nations is low, it comes at the price of a weak currency, poor economy, and, in many cases, political and economic turmoil. The decade-long conflict in Syria weakened the Syrian pound, led to a spiraling inflation and fuel shortages, and further collapsed its economy. It’s no surprise that its capital city of Damascus has maintained its position as the world’s cheapest city. Tripoli and Tehran, the capitals of Libya and Iran, respectively, follow next on this list, reflecting their weakened economies. Meanwhile, seven cities in Asia with the common denominator of high-income inequality and low wages dominate the list of the world’s cheapest cities. These include three Indian cities, Tashkent in Uzbekistan, Almaty in Kazakhstan, Pakistan’s most populous city of Karachi, and Sri Lankan capital–Colombo.