In the COVID-19 era, this difference has become more prominent as countries print vast amounts of currency to support their suffering economies. This graphic from Texas Precious Metals highlights how the value of U.S. precious metal coin production compares to U.S. money creation.
Year to Date Production
In this infographic, we have calculated the value of money supply added as well as bullion minted, and divided it by the U.S. population to get total production per person. Here’s how the January-September 2020 data breaks down: Gold and silver dollar values based on Oct 5, 2020 spot prices of $1,915.93 and $24.47 respectively. The value of new U.S. money supply was more than 2,100 times higher than the value of new gold minted. Compared to minted silver, the value of new U.S. money supply was over 6,000 times higher.
Production Per Day, Per State Over Time
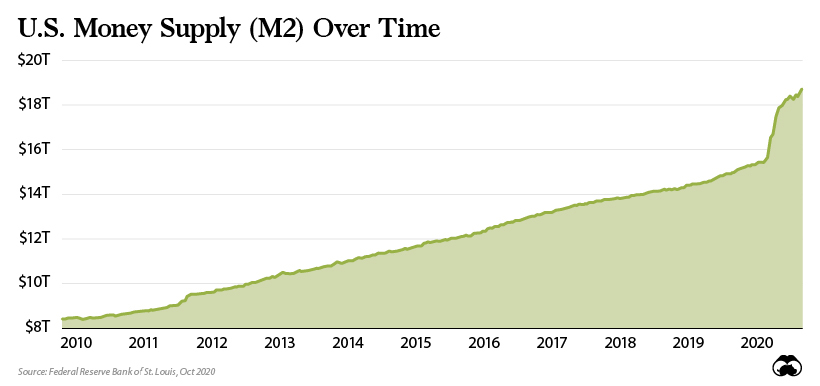
Here’s how production has changed on a per day, per state basis since 2010: Year to date, U.S. precious metal coin production is within a normal historical range. If production were to continue at the current rate through December, gold would be above historical norms at 81 ounces and silver would be within the normal range at 2,175 ounces. The issuance of U.S. dollars tells a different story. Over the last nine months, the U.S. has already added 400% more dollars to its money supply than it did in the entirety of 2019—and there’s still three months left to go in the year.
A Macroeconomic View
Of course, current economic conditions have been a catalyst for the ballooning money supply. In response to the COVID-19 pandemic, the U.S. government has issued over $3 trillion in fiscal stimulus. In turn, the U.S. Federal Reserve has increased the money supply by $3.4 trillion from January to September 2020.
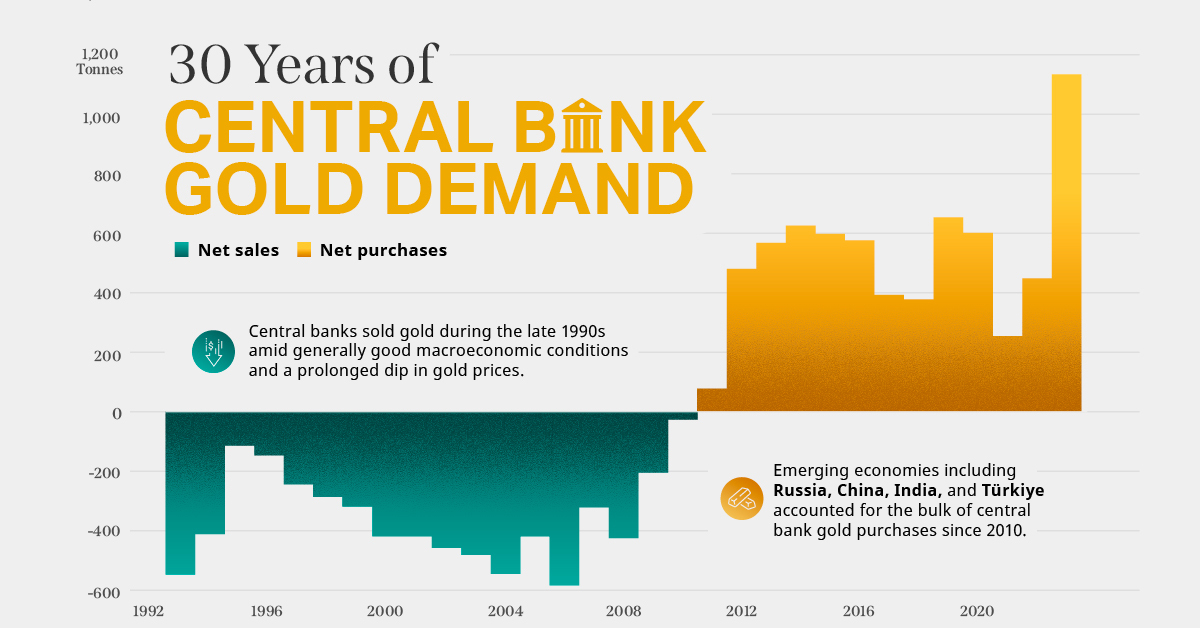
Put another way, for every ounce of gold created in 2020 there has been $4 million U.S. dollars added to the money supply. The question for those looking for safe haven investments is: which of these will ultimately hold their value better? on Did you know that nearly one-fifth of all the gold ever mined is held by central banks? Besides investors and jewelry consumers, central banks are a major source of gold demand. In fact, in 2022, central banks snapped up gold at the fastest pace since 1967. However, the record gold purchases of 2022 are in stark contrast to the 1990s and early 2000s, when central banks were net sellers of gold. The above infographic uses data from the World Gold Council to show 30 years of central bank gold demand, highlighting how official attitudes toward gold have changed in the last 30 years.
Why Do Central Banks Buy Gold?
Gold plays an important role in the financial reserves of numerous nations. Here are three of the reasons why central banks hold gold:
Balancing foreign exchange reserves Central banks have long held gold as part of their reserves to manage risk from currency holdings and to promote stability during economic turmoil. Hedging against fiat currencies Gold offers a hedge against the eroding purchasing power of currencies (mainly the U.S. dollar) due to inflation. Diversifying portfolios Gold has an inverse correlation with the U.S. dollar. When the dollar falls in value, gold prices tend to rise, protecting central banks from volatility. The Switch from Selling to Buying In the 1990s and early 2000s, central banks were net sellers of gold. There were several reasons behind the selling, including good macroeconomic conditions and a downward trend in gold prices. Due to strong economic growth, gold’s safe-haven properties were less valuable, and low returns made it unattractive as an investment. Central bank attitudes toward gold started changing following the 1997 Asian financial crisis and then later, the 2007–08 financial crisis. Since 2010, central banks have been net buyers of gold on an annual basis. Here’s a look at the 10 largest official buyers of gold from the end of 1999 to end of 2021: Rank CountryAmount of Gold Bought (tonnes)% of All Buying #1🇷🇺 Russia 1,88828% #2🇨🇳 China 1,55223% #3🇹🇷 Türkiye 5418% #4🇮🇳 India 3956% #5🇰🇿 Kazakhstan 3455% #6🇺🇿 Uzbekistan 3115% #7🇸🇦 Saudi Arabia 1803% #8🇹🇭 Thailand 1682% #9🇵🇱 Poland1282% #10🇲🇽 Mexico 1152% Total5,62384% Source: IMF The top 10 official buyers of gold between end-1999 and end-2021 represent 84% of all the gold bought by central banks during this period. Russia and China—arguably the United States’ top geopolitical rivals—have been the largest gold buyers over the last two decades. Russia, in particular, accelerated its gold purchases after being hit by Western sanctions following its annexation of Crimea in 2014. Interestingly, the majority of nations on the above list are emerging economies. These countries have likely been stockpiling gold to hedge against financial and geopolitical risks affecting currencies, primarily the U.S. dollar. Meanwhile, European nations including Switzerland, France, Netherlands, and the UK were the largest sellers of gold between 1999 and 2021, under the Central Bank Gold Agreement (CBGA) framework. Which Central Banks Bought Gold in 2022? In 2022, central banks bought a record 1,136 tonnes of gold, worth around $70 billion. Country2022 Gold Purchases (tonnes)% of Total 🇹🇷 Türkiye14813% 🇨🇳 China 625% 🇪🇬 Egypt 474% 🇶🇦 Qatar333% 🇮🇶 Iraq 343% 🇮🇳 India 333% 🇦🇪 UAE 252% 🇰🇬 Kyrgyzstan 61% 🇹🇯 Tajikistan 40.4% 🇪🇨 Ecuador 30.3% 🌍 Unreported 74165% Total1,136100% Türkiye, experiencing 86% year-over-year inflation as of October 2022, was the largest buyer, adding 148 tonnes to its reserves. China continued its gold-buying spree with 62 tonnes added in the months of November and December, amid rising geopolitical tensions with the United States. Overall, emerging markets continued the trend that started in the 2000s, accounting for the bulk of gold purchases. Meanwhile, a significant two-thirds, or 741 tonnes of official gold purchases were unreported in 2022. According to analysts, unreported gold purchases are likely to have come from countries like China and Russia, who are looking to de-dollarize global trade to circumvent Western sanctions.
There were several reasons behind the selling, including good macroeconomic conditions and a downward trend in gold prices. Due to strong economic growth, gold’s safe-haven properties were less valuable, and low returns made it unattractive as an investment.
Central bank attitudes toward gold started changing following the 1997 Asian financial crisis and then later, the 2007–08 financial crisis. Since 2010, central banks have been net buyers of gold on an annual basis.
Here’s a look at the 10 largest official buyers of gold from the end of 1999 to end of 2021:
Source: IMF
The top 10 official buyers of gold between end-1999 and end-2021 represent 84% of all the gold bought by central banks during this period.
Russia and China—arguably the United States’ top geopolitical rivals—have been the largest gold buyers over the last two decades. Russia, in particular, accelerated its gold purchases after being hit by Western sanctions following its annexation of Crimea in 2014.
Interestingly, the majority of nations on the above list are emerging economies. These countries have likely been stockpiling gold to hedge against financial and geopolitical risks affecting currencies, primarily the U.S. dollar.
Meanwhile, European nations including Switzerland, France, Netherlands, and the UK were the largest sellers of gold between 1999 and 2021, under the Central Bank Gold Agreement (CBGA) framework.
Which Central Banks Bought Gold in 2022?
In 2022, central banks bought a record 1,136 tonnes of gold, worth around $70 billion. Türkiye, experiencing 86% year-over-year inflation as of October 2022, was the largest buyer, adding 148 tonnes to its reserves. China continued its gold-buying spree with 62 tonnes added in the months of November and December, amid rising geopolitical tensions with the United States. Overall, emerging markets continued the trend that started in the 2000s, accounting for the bulk of gold purchases. Meanwhile, a significant two-thirds, or 741 tonnes of official gold purchases were unreported in 2022. According to analysts, unreported gold purchases are likely to have come from countries like China and Russia, who are looking to de-dollarize global trade to circumvent Western sanctions.